


Description
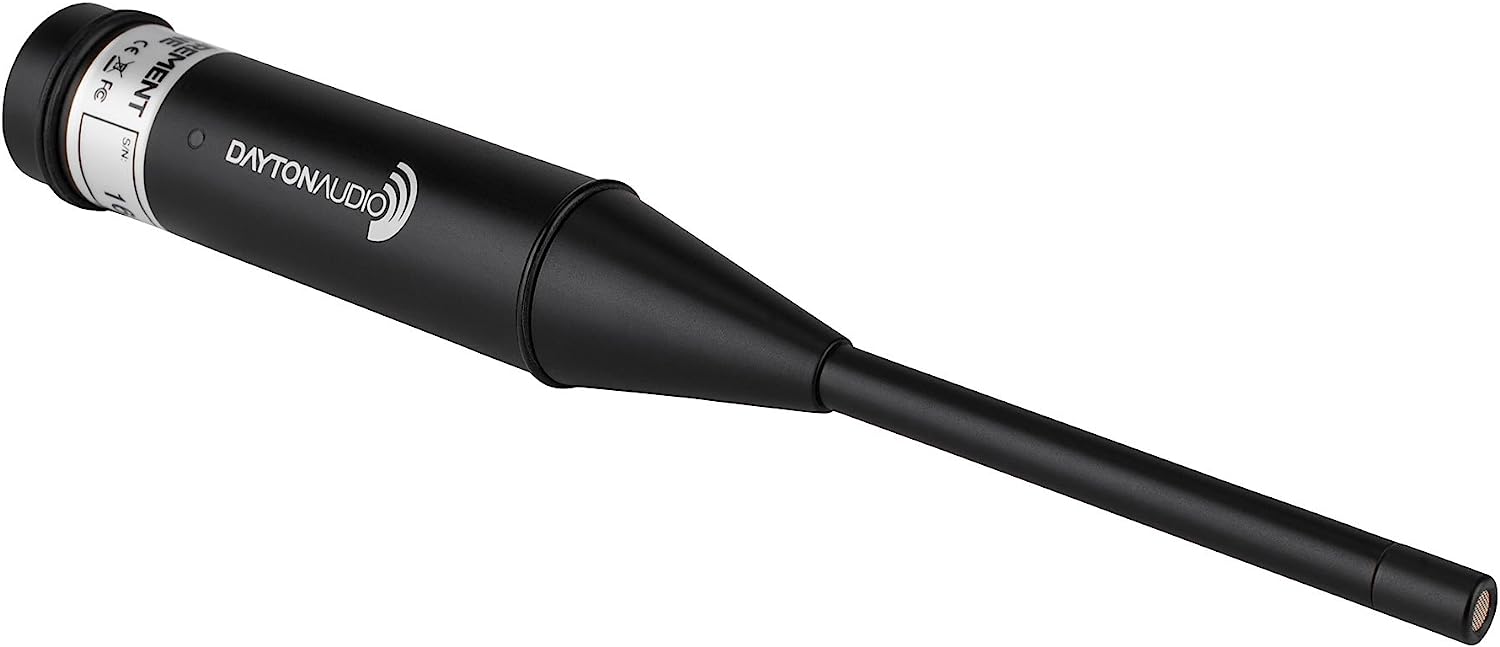
Dayton Audio's UMM-6 USB measurement microphone matches the level of precision previously offered only by expensive measurement equipment.
Key Features
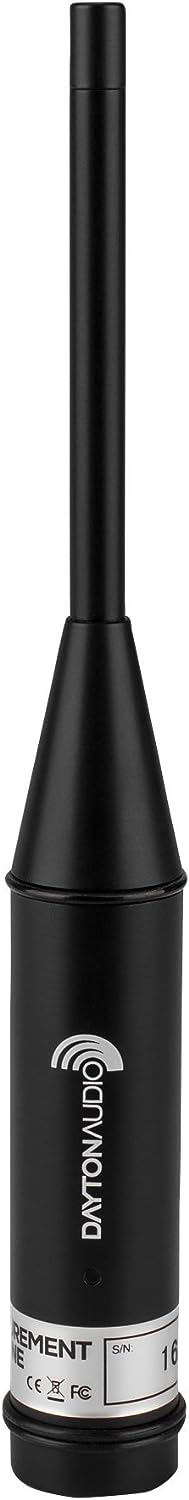
- Precision condenser microphone for critical measurement and recording applications
- Connects to your PC or Mac via USB port
- True omnidirectional pattern and calibrated flat frequency response
- Rugged construction with high-quality components
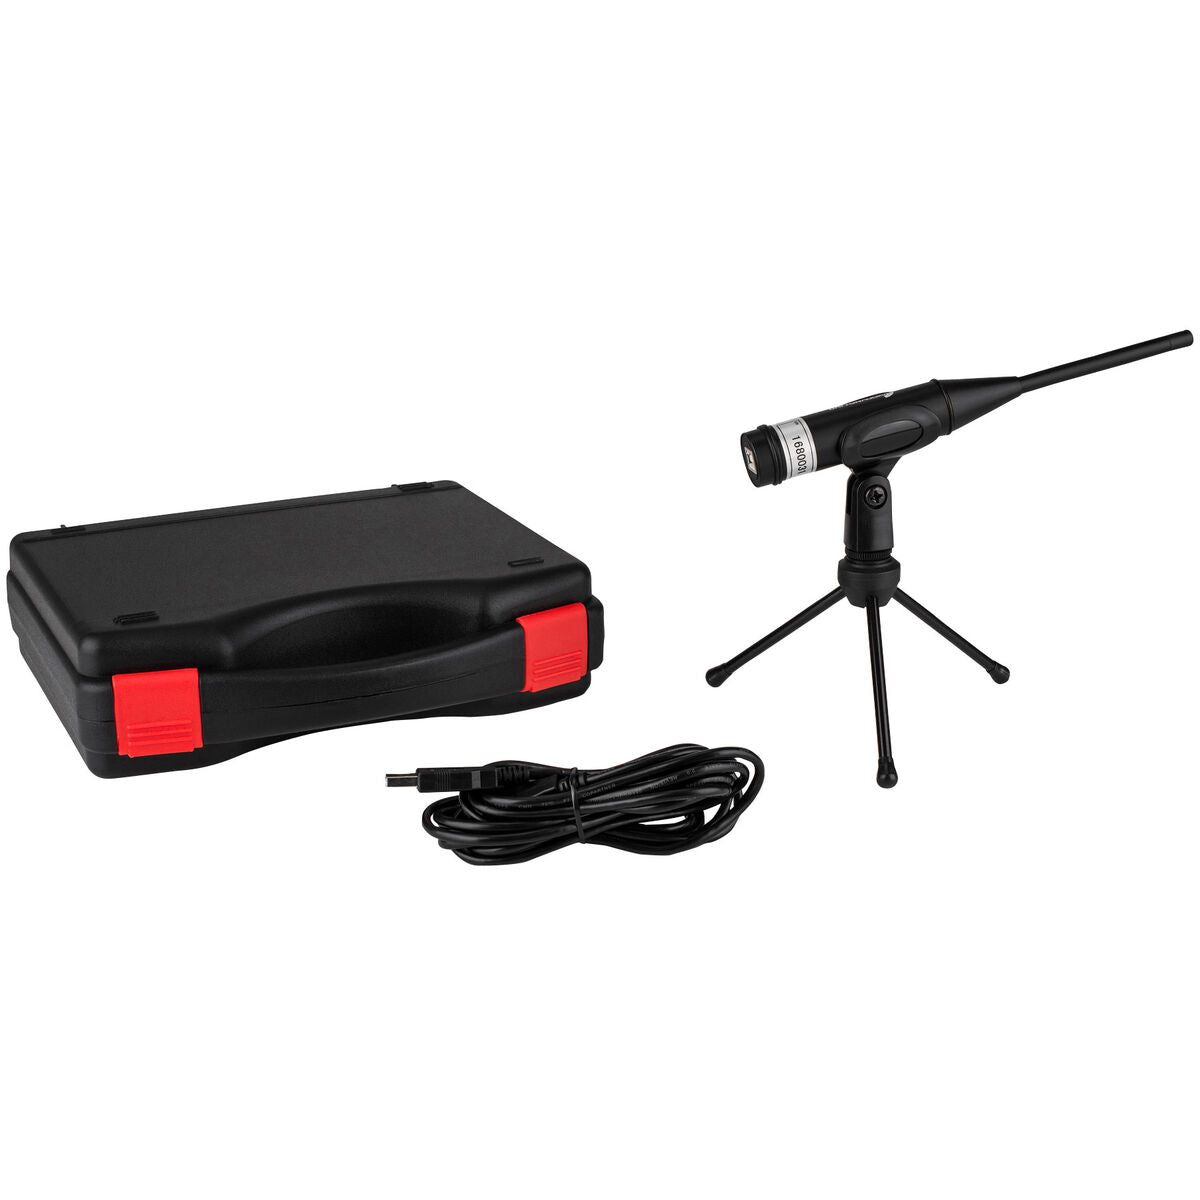
- Compact design; includes sturdy carrying case with foam insert
- Compatible with most industry-standard measurement software
The Dayton Audio UMM-6 professional-quality USB measurement and recording microphone is designed to work with industry-standard third party recording and measurement software. The rugged construction and compact size make it the perfect companion for audio professionals who must work on-location performing acoustic analysis, monitoring audio levels, or recording. Each UMM-6 is calibrated individually using a laboratory-standard reference microphone, for consistent, repeatable PC measurements that match the level of precision offered previously only by expensive stand-alone microphones and measurement equipment. Works great with the Room EQ Wizard software.
Measurements
Combining the UMM-6 and Room EQ Wizard provides you with an array of tools that are great for all audio engineers.
- Sound level meter with full integrating functionality including equivalent sound level and sound exposure level; mic/meter and soundcard calibration corrections applied; A, C or Z weighting
- Real Time Analyser with up to 1/48th octave resolution
- Frequency response and distortion measurement using logarithmically swept sine signals for fast, accurate analysis of room acoustics and audio performance
- Two channel oscilloscope with a math channel
- Harmonic and intermodulation distortion measurement including harmonic phase
- RT60 Decay plot using frequency domain analysis to provide decay data at much higher resolution and with narrower octave fractions than is possible with classical RT60 analysis
- Impulse Response delay calculation and adjustment
- Spectral decay plots, waterfalls (Fourier and Burst Decay) and spectrograms (Fourier, Burst Decay and wavelet)
- Signal Generator with 11 different functions
- Clarity and definition parameters C50, C80 and D50 plus centre time Ts
- Impedance measurement including Equivalent Peak Dissipation Resistance (EPDR) plot, component model for inductor and capacitor measurements
- Thiele-Small parameter calculation from sealed volume, added mass or dual added mass impedance measurements
- Automatic identification of peaks in the response, automatic assignment of EQ filters to peaks and optimisation of filter parameters to counter the peaks and track a desired target response
- Room Simulator supporting up to 8 subwoofers
- Room resonance analysis to determine the frequencies and decay times of modal resonances with pole-zero plots of the response and any filters applied
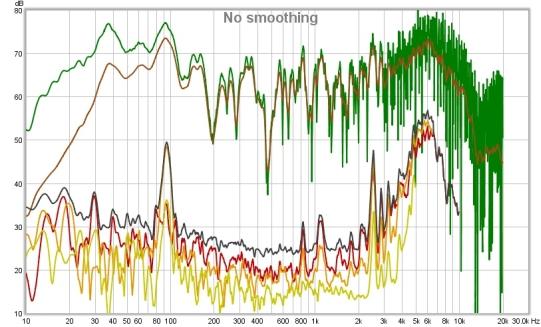
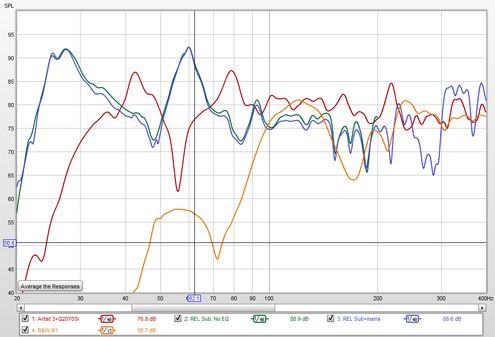 Frequency Response
Frequency Response is a curve that shows how strongly an audio system reproduces different parts of the frequency range. A frequency response is related to its "impulse response" (the pressure signal that a speaker or sound system would make if it were fed by an extremely short pulse).
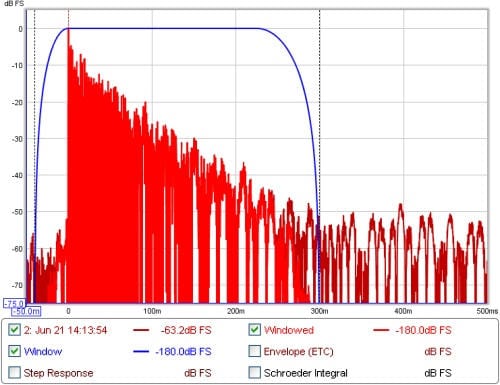 Impulse Response
The purpose of a Impulse Response is to reveal how the frequency response of a loudspeaker is affected by the room at the location of the microphone.
 Harmonic Distortion
Harmonic distortion is the unwanted addition of new tones to the original audio signal. These distortion products occur at multiples of the original frequency and are centered on the harmonics of the original. For example, a 1kHz fundamental that has been subjected to harmonic distortion will produce energy at 2kHz (2nd harmonic), 3kHz (3rd harmonic), 4kHz (4th harmonic), and so on.
 Cumulative Spectral Decay
A waterfall (or CSD) illustrates, on a 3-D graph, how a speakers' energy decays or is radiated over a range of frequencies. Waterfall plots are used by driver and loudspeaker designers for driver selection, to identify resonances or reflections, and to view driver and waveguide behavior.
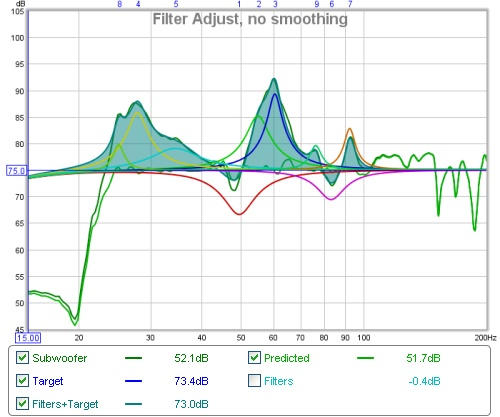 Automatic EQ
The EQ window allows you to customize and visualize the effects of filters based on the measurements taken with the UMM-6
 SPL Meter / Spectrum Analyzer
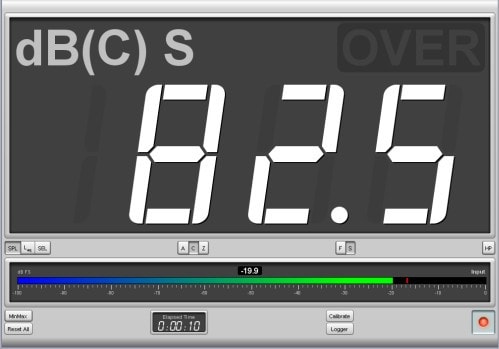
The SPL (sound pressure level) meter allows you to measure how loud your source is while the spectrum analyzer shows you the relative SPL of frequency bands.
 Oscilloscope
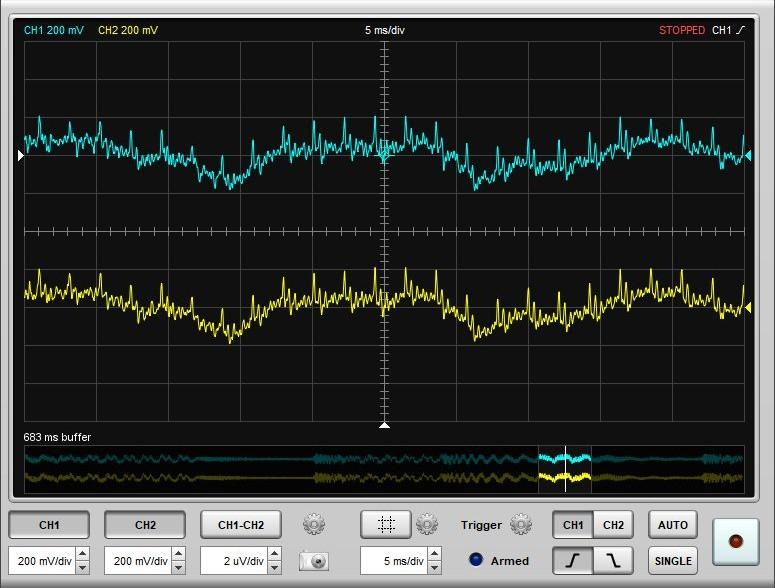
Use the Oscilloscope to view any sound waveforms. These might include music, your voice, or waveforms played by loudspeakers.
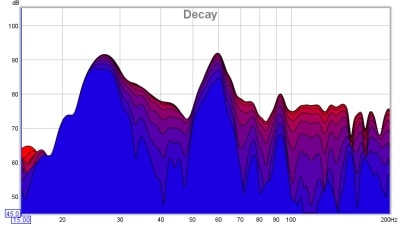
 RT60 Analysis
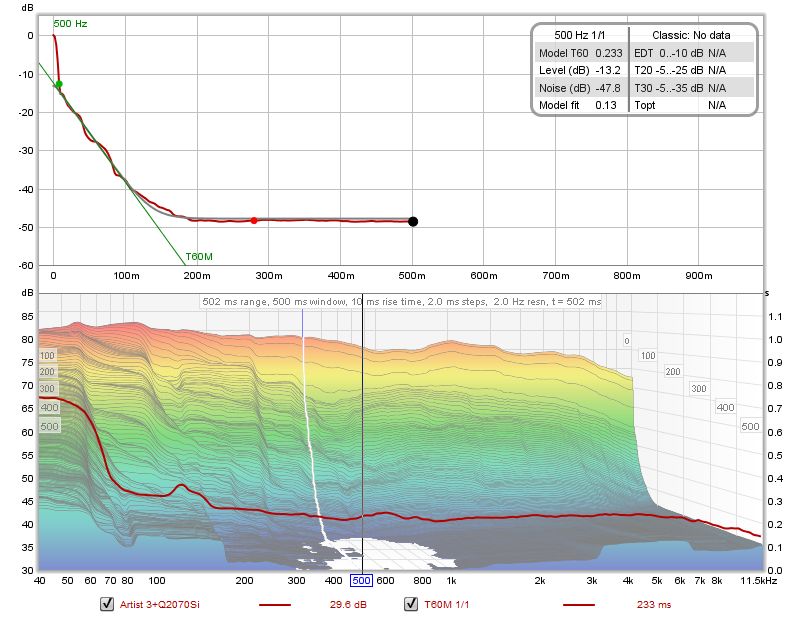
Use the Bass Decay analyzer to measure how bass notes decay in a room. This is a great measurement to understand how the room affects the low end.
Calibrate Your UMM-6
A unique serialized calibration .txt file will be available for your UMM-6. Once you receive your microphone, Visit the Dayton Audio calibration download tool where you will be prompted to enter the serial number found on the base of your calibrated UMM-6. After entering the serial number, your unique calibration .txt file will be available for you to download.
